As the FTSE 100 recently turned 40, we look at how it compared to its predecessor and the lessons from our four decades of growth versus inflation.
The Financial Times Stock Exchange (FTSE) 100 Index recently celebrated its 40th anniversary. It is a significant milestone and an opportunity to take stock (pun intended) of the index’s history and position.
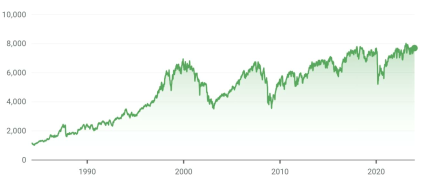
Source: Google Finance
The UK’s benchmark stock market index was launched in 1984 by the London Stock Exchange, designed as a modern successor to the FT30 Ordinary Share index produced by the Financial Times. The FT30 was a product of a pre-digital era and was once calculated using a slide rule. There are other starker comparisons with the 100-share FTSE 100:
- The FT30 shares were hand-picked by an editorial team at the Financial Times. The index was prone to age poorly given its data was only changed if a merger or bankruptcy existed. In contrast, the FTSE 10’s constituents are selected according to a detailed set of rules, largely driven by company size, and reviewed quarterly.
- Weighting played another key difference. To simplify life for the slide rule user, each company in the FT30 had an equal (3.33%) weighting in the index, regardless of its market size. In contrast, the more sophisticated FTSE 100 weighted each share according to corporate value. That means that just five companies – Shell, AstraZeneca, HSBC, Unilever and BP – account for nearly one third of the index.
From its initial launch value of 1,000, the FTSE 100 climbed to 7,721.52 by its 41st year in January 2024. That equates to an annual growth rate of 5.2%. Inflation over the same period, as measured by the Retail Prices Index (RPI – the CPI does not go back beyond 1988) averaged about 3.7% yearly.
Like most indices, the FTSE 100 measures only capital values and does not include dividends. When dividends are considered, the total return on the FTSEE 100 rises to 8.2%, an annual 4.5% outperformance of inflation. Dividends are still a key factor in the returns from the FTSE 100 today, with the Index offering a dividend yield of close to 4%.
If there is one lesson from the FTSE 100’s legacy of the past four decades, it is that the next time you see or hear its performance being quoted, check whether dividends have been taken into account.